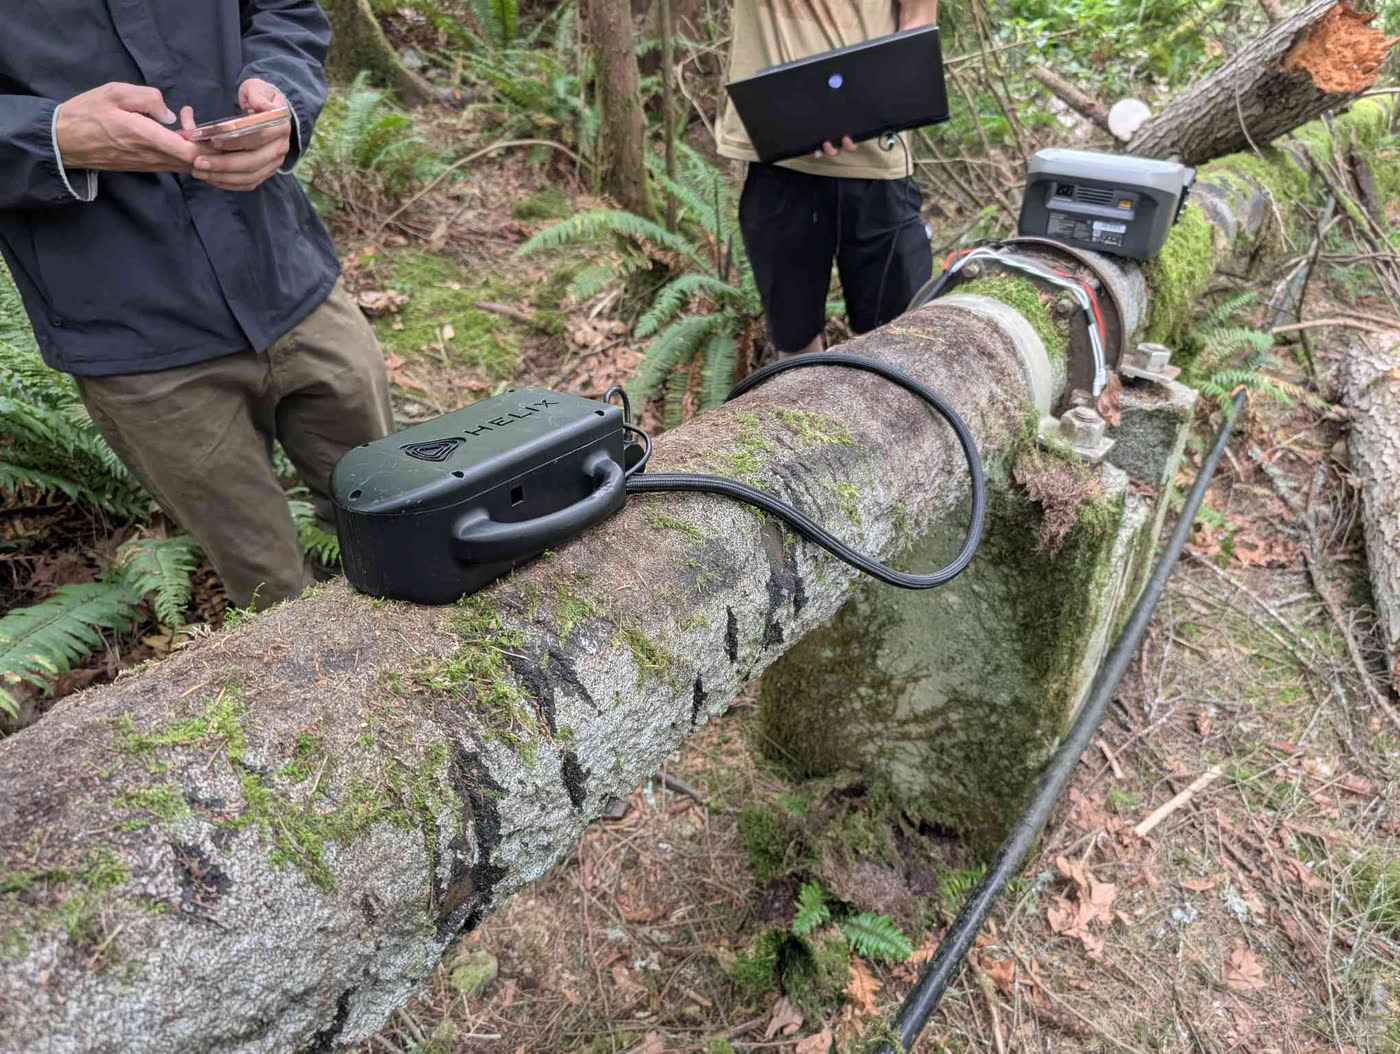
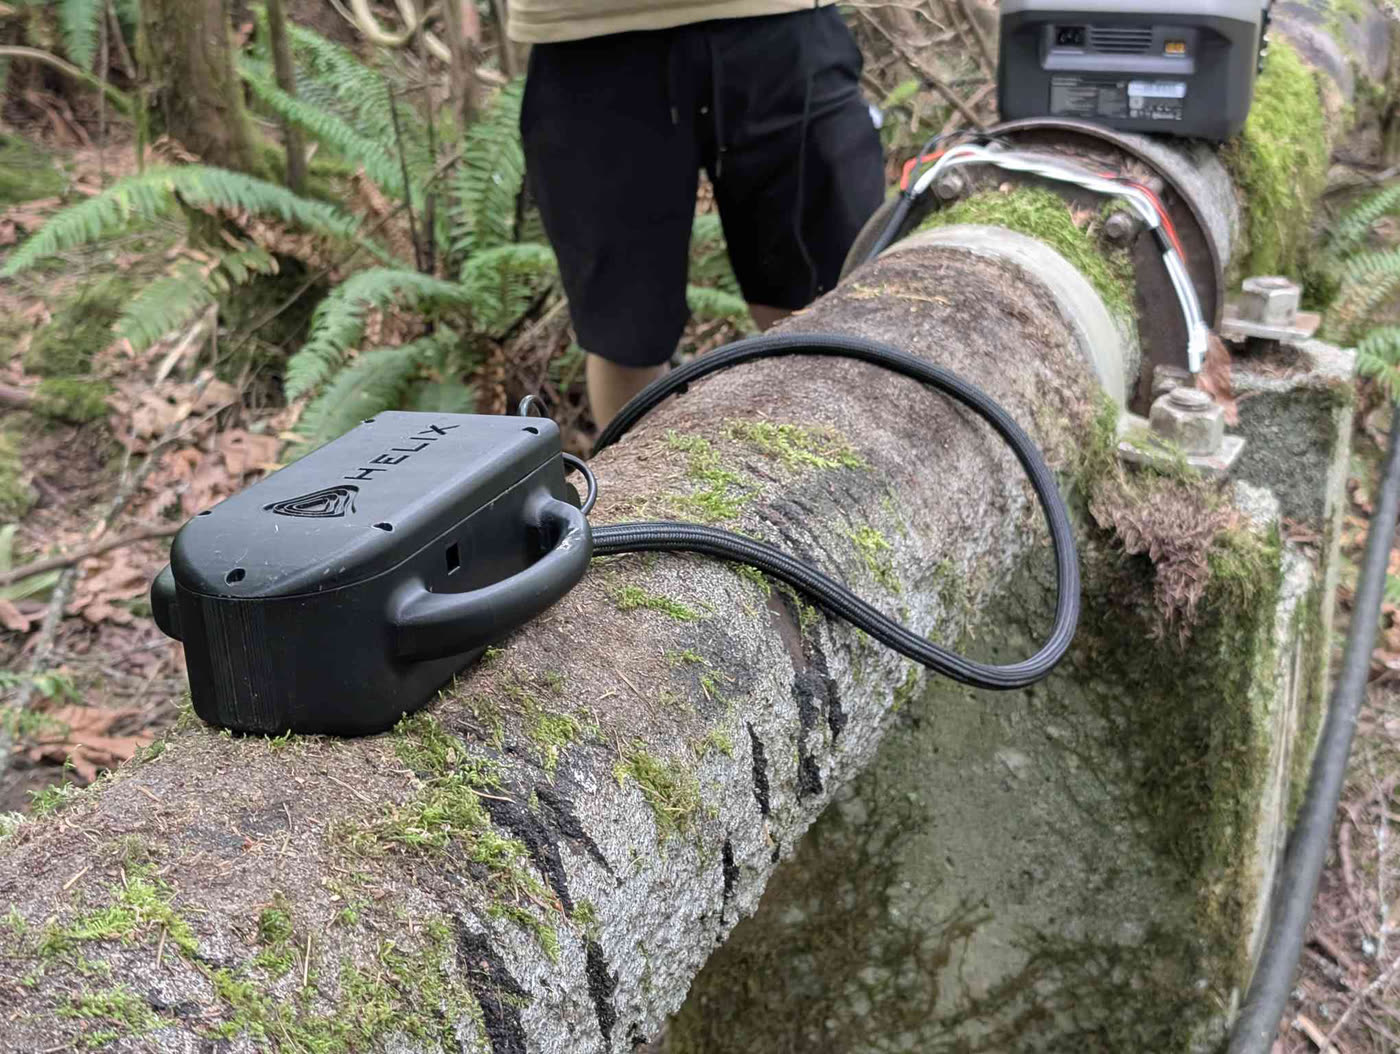
A 3D model of the real asset, with every reading on it.
A walk through HELIX Horizon: an asset dashboard, a LiDAR scan of a pipeline, the pulsed eddy current wall map laid over it with its histogram, a point-of-interest card, and the wall-thickness forecast with its risk curve
Horizon registers every screening and monitoring result to its physical location on a LiDAR and photogrammetry model of the real asset, then trends and forecasts it.
Every screening and monitoring result lands on its physical location on the model. The heatmap shows wall thickness across the whole scanned surface, so thinning is found where it actually is.
A slow pass along a pipe gallery at a Fisheries and Oceans Canada site, captured in 3D, its wall-thickness readings mapped along the pipe in green, yellow and red
A Fisheries and Oceans Canada pipe gallery in HELIX Horizon, with the wall map along the pipe.
Each scan lands on the same model as the last one. What you get is a rate of change per location, with the evidence behind it.
A scanned pipe elbow in HELIX Horizon, with a date slider dragged back and forth
Scan history on an elbow: the slider replays each scan in order.
Run the trend forward against your minimum allowable wall. The answer is a date and a confidence band, which is what a shutdown gets planned around.
The predicted wall thickness fan in HELIX Horizon, with the time cursor dragged forward
The wall-thickness forecast, with the time cursor dragged forward.
What Horizon shows
PEC and ECA heatmap layers on the 3D model, with per-zone histogram analysis
Point-of-interest cards with a guided asset tour
Scan replay in capture order, and a scan-history time slider
Sensor mean over time: longitudinal analytics across repeat measurements
Probabilistic wall-thickness forecast with a criterion line and a risk curve
Client portal with per-client dashboards, KPI tiles, site and asset cards, and a preview-as-client mode
Limits
Colours in Horizon heatmaps are relative to each scan. They mark the lowest and highest readings shown, not safe or unsafe limits. Forecasts are statistical trending of the measured rate of change, not a trained model.